Customers, investors and regulators increasingly ask for freight emissions data. Accurate measurement is the first step to reducing them, and it is easier than most shippers expect.
Freight is often one of the largest sources of indirect emissions for companies that make or sell physical goods. Yet many still report it with rough estimates based on total spend. As disclosure rules tighten and large buyers ask their suppliers for real figures, shippers need numbers they can defend.
How freight emissions are calculated
Emissions are calculated per shipment from three inputs: distance, weight and transport mode. Each mode has an emission factor per tonne-kilometre, set out in recognized international methods. Multiply the three and you have a figure for every move, which can then be summed by lane, customer or product. Empty runs, repositioning and terminal handling can also be included for a more complete picture.
The quality of the result depends on the quality of the data. Actual weights and routed distances give far better results than averages, which is why shipment-level data from your forwarder matters. Spend-based methods can overstate or understate emissions by a wide margin, and they cannot show whether a change in routing or mode actually made a difference.
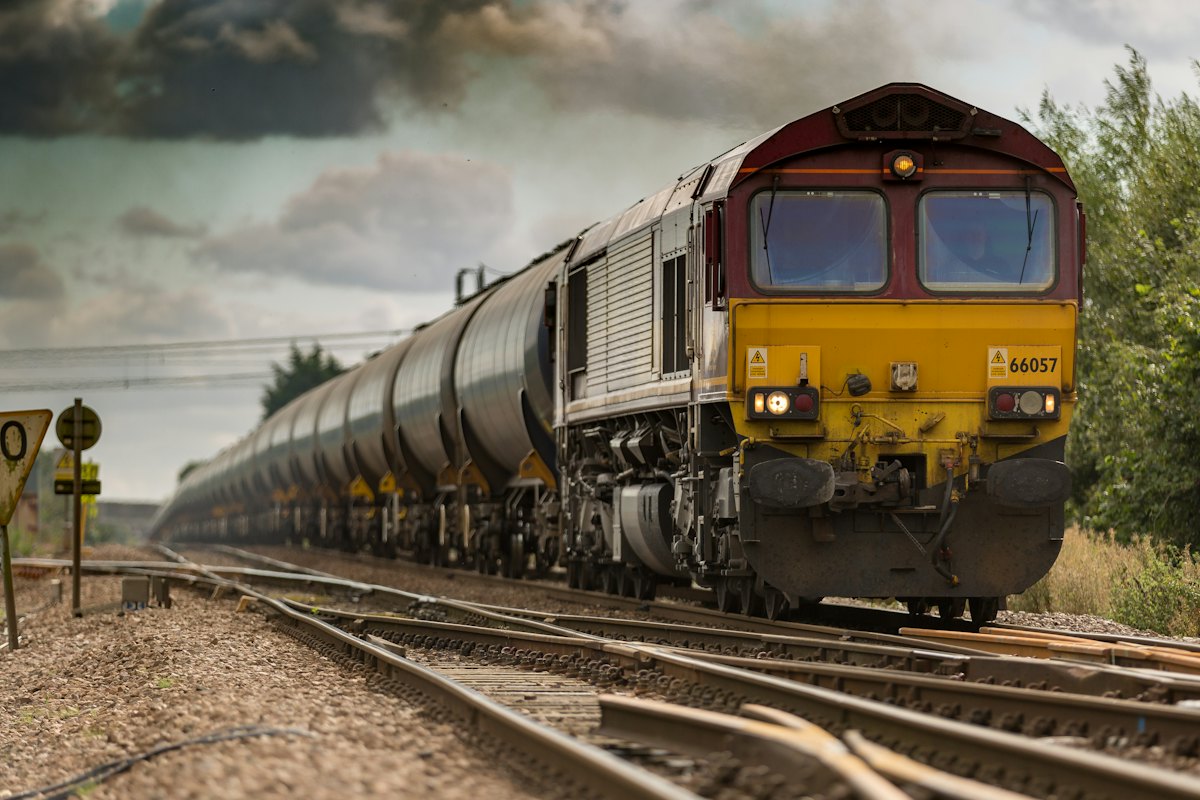
Typical intensity by mode
The differences between modes are large. The figures below are typical industry estimates and vary with load factor, vehicle type and energy source.
| Mode | Relative CO₂ per tonne-km | Main lever |
|---|---|---|
| Air freight | Very high | Shift to ocean or rail |
| Road (truck) | Medium | Fuller loads, cleaner fuels |
| Rail | Low | Electric traction |
| Ocean | Very low | Slow steaming, larger vessels |
Where the biggest gains come from
Once you have a baseline, the biggest reductions usually come from three places: shifting volume to lower-carbon modes, improving load factors and cutting the number of urgent shipments. Moving even a small share of air freight to ocean can outweigh years of smaller efficiency gains. The key is to plan these changes with sales and production, so that slower transit times are built into lead times rather than discovered at the last minute.
- Mode shift: Move planned, non-urgent volume from air to ocean or from road to rail.
- Load factor: Consolidate part loads so fewer trucks and containers run half empty.
- Better planning: Forecast demand earlier to reduce costly and carbon-heavy rush shipments.
- Network design: Place stock closer to customers to shorten the final road legs.
Turning data into reports
Our monthly reports show emissions by lane and mode, ready for your sustainability disclosures. Because the data comes from actual shipments, you can see the effect of each change rather than waiting for an annual estimate. The figures can be split by business unit, customer or product line, and exported in a format your sustainability team can drop straight into their disclosures. Many of our customers also share the reports with their own buyers, who increasingly ask for this data during tenders.
“You cannot manage what you only estimate once a year. Shipment-level data turns emissions from a reporting chore into something your logistics team can actually improve.”
Tom Becker, Head of Trade Compliance at Cargo
Key takeaways
- Freight emissions are calculated from distance, weight and transport mode.
- Shipment-level data is far more accurate than spend-based estimates.
- Mode shift, fuller loads and fewer urgent shipments deliver the largest reductions.
Ready to build your freight emissions baseline? Request a quote and ask about our monthly emissions reporting.